Geographies of diversity and ethnic mixing

geographies-of-diversity-coverThis release explores population change between censuses for ethnic minority groups in Bradford; describing the geographic distribution at ward level for each largest minority group. Segregation is considered using a dissimilarity index for ethnic minority group separation, including changes between censuses.

Summary findings

  • The non-white population in Bradford has grown by 68,500 persons over the past decade, which is an increase of two-thirds.
  • The ethnic minority population now represents one-third of the total population of Bradford.
  • The White British group remains the largest population accounting for more than 3 out of every 5 residents.
  • By far the largest ethnic minority group are Pakistani, accounting for around one-fifth of the population in Bradford.
  • The Bangladeshi population has almost doubled over the past decade, now with around 10,000 residents.
  • Black ethnic groups had the largest rate increase since 2001, however the Chinese population decreased by almost one-third.
  • Ethnic minority groups tend to be clustered around inner city Wards, and Keighley Central.
  • Residential mixing over the past decade had a general movement toward less separation for many ethnic minority groups.
  • The degree of this separation varies between groups, with Bangladeshi and Pakistani the most segregated and White Irish the least.

To open this statistical bulletin please click here.

How place influences employment outcomes for ethnic minorities

JRF-logoThis research looks at the influence of location on employment for ethnic minorities, asking why ethnic minority people fare disproportionately worse in the labour market in areas of high deprivation.

It examines the roles of culture, racism and class, and of familial, community and state support in affecting employment outcomes. It found that: Racism in education and employment varies by locality, contributing to differences in outcome by location.

Key points

  • Racism in education and employment varies by locality, contributing to differences in outcome by place.
  • Knowledge of education and labour market systems, and how to negotiate them, affects employment outcomes. Social segregation and migration tend to reduce knowledge and negotiating ability, leading to differing employment outcomes by place.
  • Whilst social segregation may provide support, it can also reduce employment performance, limiting social networks and inhibiting labour market knowledge. For some ethnic groups, segregation reinforces cultural norms of women’s role as nurturer rather than breadwinner. Self-employment appeared to exacerbate social segregation, especially where labour was limited to family.
  • There was some evidence that the relative size of ethnic minority groups in a locality might affect employment outcomes, with local policies likely to serve the largest ethnic minority group. This would contribute to differences in employment outcomes by place and should be explored further.
  • The extent to which education policies support all groups to benefit equally from education and careers support varies with place and differences in outcomes by ethnicity and migrant history result.
  • Providers of educational, careers and employment services need to reduce variations in access to services. Appropriate approaches may or may not be targeted at or tailored towards specific groups by ethnicity. However, it will be important to monitor by ethnicity how well key groups are served, particularly if the approach is not targeted.

To open the full report please click here.

Caring and earning among low-income Caribbean, Pakistani and Somali people

JRF-logoThis research looks at the experiences and preferences of low-income Caribbean, Pakistani and Somali people in balancing work and care responsibilities. It examines the particular challenges faced by these ethnic minority groups, and the challenges for employers and policy.

For most people, the two most important roles in life are caring for loved ones and working to earn a living. Over the past decades, more people have entered the labour market, while the proportion of those providing care has risen too. These developments create challenges for those seeking to ‘balance’ work and care, and are likely to continue given underlying demographic changes and developments in the labour market.

Key findings

  • Discrimination prevents low-income ethnic minority people from balancing work and care;
  • Many people are unaware of free childcare provision for 2-4 year olds;
  • Benefit changes are likely to make it more difficult to balance work and care for these people;
  • Attitudes towards caring vary greatly across ethnic groups; and
  • Caring responsibilities were predominantly taken up by women.

The report in full can be opened by clicking here.

Non-UK Born Population of England and Wales Quadrupled Between 1951 and 2011

obs-blog-ons-logoThe latest Census analysis looked at changing migration patterns over 60 years.

Migration is an important driver of population change, currently accounting for around half of the population growth in England and Wales; with natural change (births and deaths) accounts for the remaining population change. Historic census data has been used to show the growth in the non-UK born population between 1951 and 2011.

This infographic shows the top ten non-UK countries of birth in each census year since 1951.

In summary

  • Non-UK born population quadrupled between 1951 and 2011
  • Non-UK born population has become more diverse since 1951
  • Numbers of Irish-born residents in England and Wales decreased
  • Those born in India were the largest group in 2011 at 694,000
  • 10 fold increase in Polish migrants over ten years from 2001-2011

To open the analysis in full please click here.

Ethnic inequalities in labour market participation?

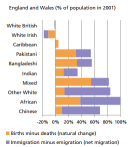
ethnicity-blog-img-1Using recently published 2011 Census data the Centre on Dynamics of Ethnicity has analysed ethnic differences in labour market participation for men and women aged 25 to 49 in England and Wales.
Summary findings

  • The White ethnic groups(with the marked exception of the Gypsy or Irish Traveller group) were in a more advantaged position in the labour market compared with other ethnic groups.
  • This advantage is apparent from rates of economic activity and unemployment. For economic activity, only Indian men and Black Caribbean women had a similar rate to the White ethnic groups. For unemployment, Pakistani men had rates that were one and a half times the rate for White British men, and Black Caribbean men had rates almost three times as high. Pakistani women’s unemployment rate was more than three times White British women’s, and for Black Caribbean women, unemployment was more than twice White British women’s.

  • Women had lower rates of economic activity than men in all ethnic groups. However, this difference was greatest for Bangladeshi (87% for men vs. 40% for women), Pakistani (88% vs. 43%), Arab (69% vs. 40%) and White Gypsy or Irish Traveller (67% vs. 41%) groups.
  • The White Gypsy or Irish Traveller group was particularly disadvantaged. Both men and women had very low rates of economic activity (67% for men and 41% for women) and very high rates of unemployment (16% for men and 19% for women).
  • Men and women in each of the Black and Mixed Black ethnic groups, except for Black Caribbean women, had high rates of unemployment.
  • One third of Bangladeshi economically active men were in part-time work, a surprisingly high rate that was equivalent to that for Bangladeshi women.

To open the full briefing please click here.

2011 Census Briefing

Using detailed characteristics from the 2011 Census this briefing considers ethnicity, language and health.

Ethnicity by age

obs-blog-eth-age-1Different ethnic groups have very different age profiles. The mixed ethnic group has the youngest age profile, with 65.8% under 25 years of age. Of the South Asian ethnic groups, the Bangladeshi ethnic group has the youngest age profile – 42.2% are under 16 years of age and 57.4% under 24 years of age. In line with national trends the Irish ethnic group is the oldest in the District, with nearly 40% over 65 years of age.

To download the full briefing note click here.