Disability Free Life Expectancy at Birth and at ages 50 and 65 by Clinical Commissioning Groups, England, 2010-12

2011Census-logoDisability-free life expectancy (DFLE) estimates provide an insight into the population’s functional health by indicating the number of years an individual might expect to spend free from a limiting disability or health problem in his or her lifetime.

Using 2011 Census data, this analysis is the first to calculate DFLE by the newly established NHS Clinical Commissioning Groups. DFLE estimates are useful for those who plan and provide health and social care, nationally as well as locally.

Key points

  • Females spend more of their life with a disability compared with males, showing gender inequality in disability-free life expectancy (DFLE) across England.
  • Generally people living in Clinical Commissioning Groups (CCGs) in the North of England live more years with a disability compared to those in CCGs in the South.
  • Differences in DFLE are not solely confined to the North-South divide; males and females living in NHS Tower Hamlets.
  • The CCG with the largest difference between males and females in the proportion of life spent disability free is NHS Bradford City; 6.4 percentage points at birth and 9.6 at age 50.
  • At age 65 London based CCGs NHS Brent and NHS Harrow have the largest difference between males and females in the proportion of life spent disability free (8.7 percentage points).

The report in full can be opened by clicking here.

An interactive map is also available.

What does the 2011 Census tell us about health and disability?

health&disability-infographicThe Office for National Statistics analysis looks at how age and area influence ‘Good’ health among disabled people.

A disability is not a barrier to ‘Good’ health

Across England and Wales the proportion of people who are in ‘Good’ health despite a disability increases with age from around one in fifty children (0 to 15) to around one in six elderly (85 and over). However, in some ways this simply reflects the increased incidence of disability at older ages.

The likelihood of being in ‘Good’ health despite a disability however decreases with age, more than half of all disabled children are in ‘Good’ health compared to a fifth of adults aged over 50. This may be because children with a disability (or the parents and carers of children with a disability) have a more positive outlook than adults when it comes to thinking about their general health. The findings may also reflect more adequate health and social care provision among the young disabled population, allowing them to overlook the limitations of their disability.

Disabled males are more likely to be in ‘Good’ health than disabled females

Among the disabled population males are more likely than females to be in ‘Good’ health despite their disability, particularly when their disability limits them a lot in their day-to-day activities. Differences are most noticeable at younger ages which may reflect different social and cultural attitudes to health among males and females at different ages.

Strong relationship between where you live and how you view your general health

Disabled people living in more affluent areas are more likely to be in ‘Good’ health than disabled people living in more deprived areas. After the age of 35 the proportion of disabled people with ‘Good’ general health in the most affluent areas is around twice that of disabled people living in the most deprived areas. This may be because people living in more affluent areas are more able to overcome the limitations of their disability and so judge their general health more favourably. It may also because people living in more affluent areas have better access to adequate health and social care than people living in more deprived areas.

Health inequality widest in older middle-aged

2011Census-logoNew analysis from the Office for National Statistics focuses on the extent of inequality in health and disability between more and less disadvantaged populations in England using Census 2011 and area deprivation data. 

The distribution of health and disabling health conditions across the population of England is shown to follow a sizeable, persistent and incremental pattern; health outcomes generally worsen in line with greater levels of socio-economic disadvantage.

Key points

  • Men and Women (aged 40 to 44) living in the most deprived areas are around four times more likely to have ‘Not Good’ health compared to their equivalent in the least deprived areas.
  • Inequalities in health remain large, even at older ages; in the least deprived areas people aged 80 to 84 reported better rates of health than those 20 years their junior in the most deprived areas.
  • The inequality in health between the most and least deprived areas peaks at ages 55 to 59 for women and 60 to 64 for men.
  • Future fitness to enjoy retirement is likely to be more favourable for the least deprived population than the most deprived; at ages 60 to 64 disabling health problems are much less common among the least deprived.
  • The disability prevalence divide between the most and least deprived areas is large across the working ages of 30 to 64, where adults are expected to participate in the labour market.
  • The fact that both men and women in the least deprived areas aged 65 to 69 have similar percentages disabled as those aged 40 to 44 in the most deprived areas suggests fitness to extend working careers post the traditional state pension age for men (65) is more likely among the least deprived area residents.

The full report can be opened here.

Severe disabilities may be restricting workers’ access to top jobs and careers

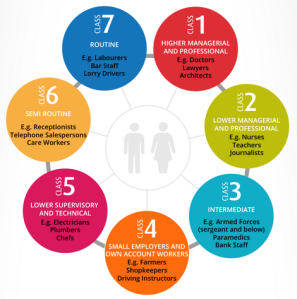
obs-blog-disability-logoIn England and Wales, the ‘higher managerial and professional’ occupation category had the lowest proportion of workers with severe disabilities in 2011.

An examination of the rates of ‘Limited a Lot’ from the 2011 Census show a pattern of increasing prevalence with decreasing occupational advantage. This infographic produced by ONS illustrates how people with more severe disabilities are distributed across the socio-economic position of occupations, and their analysis provides an insight into what extent disabled individuals can access jobs in higher classified occupations following recent Equality legislation.

Key points

  • The rates of disability prevalence vary substantially by socio-economic class throughout England and Wales.
  • There is a marked North-South divide in disability prevalence rates; rates were generally higher in the North and Wales for all socio-economic classes.
  • Men and women in the least advantaged ‘routine’ occupations had the highest rates of disability in every English region and Wales (while the most advantaged ‘higher managerial and professional’ occupations had the lowest rates), although some cross over is observed at local authority level.
  • The regional inequality in disability prevalence is mostly larger for men, except for Wales where it is larger for women.
  • The London Borough of Islington had the largest inequality in disability prevalence between occupational classes for both men and women; a difference of 29.4 and 26.5 percentage points respectively.
  • The local authorities with the largest inequality in disability prevalence are generally found in large population centres such as Inner London or in former heavy industrial centres of South Wales.

Please click here to open the full report.