How have local levels of fertility changed since 2001?

The Office for National Statistics has released an interactive mapping tool, with users able to analyse trends in total fertility rates (TFRs) for local authorities in England and Wales from 2001 onwards. The tool shows how fertility rates have changed over time and enables comparisons between local authorities and with the overall national picture.

ons-interactive-fertility-tool

Qualifications and Labour Market Participation in England and Wales

2011Census-logoFewer than half of those with no qualifications were in employment

source: ONS, 2014

Focusing on usual residents aged 25 to 64, in 2011:

  • Fewer than half (48.5%) of those aged 25 to 64 with no qualifications were in employment compared with 8 in 10 (80.7%) of those with at least one qualification.
  • While there was only a small difference in employment rates between the two highest levels of qualification, 2+ A Levels or equivalent (83.5%) and degree level or above (85.3%), those aged 25 to 64 with a degree level or above qualification were more likely to work in occupations with higher earnings.
  • The unemployment rate for both men (12.9%) and women (10.8%) aged 25 to 64 with no qualifications was more than double the rate for those with at least one qualification (5.2% for men, 4.3% for women).
  • The range of employment rates across local authorities was widest for those aged 25 to 64 with no qualifications (37.2 percentage points) and narrowed as the qualification level increased, with the narrowest range for those with a degree level or above (11.3 percentage points).
  • All five local authorities with the highest employment rates for those aged 25 to 64 with no qualifications were rural areas, with the highest rate in Eden at 67.2%, whereas all five with the lowest employment rates for those with no qualifications were urban areas, with four of these being in Inner London and the lowest being Tower Hamlets at 30.0%.

For local Census analysis please click here.

Mid-2013 Population Estimates

mid-2013-popest-cover-pgThis release reports the mid-2013 estimates for Bradford in the context of the sub-region and historical mid-year estimates. Age structure and its distribution is explored.

Key findings

  • The rounded mid-2013 estimate for Bradford is 526,400 persons, with a median age of 35.2 years.
  • The population increased by 1,750 on the previous year’s estimate, with natural change (births – deaths) at +3,600, net internal migration -3,550 and net international migration +1,700 persons.
  • Natural change is a major driver to population growth, with international net in-migration historically significant and internal net out-migration substantial.
  • The dynamics of population change in Bradford appear to be operating differently compared to our sub-regional neighbours.
  • Bradford has a young age profile compared to our neighbours, with 1 in 4 (23.5%) of the total under 16 years.
  • The proportion aged 20 to 42 match the distribution for England, with the bulk proportionally less aged over 42 years.

To open this bulletin please click here.

Bradford’s population projected to grow to 598,000 persons by 2037

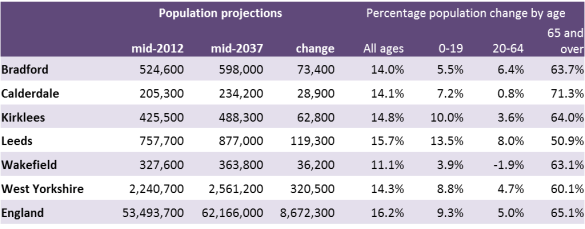
The primary purpose of the sub-national projections is to provide an estimate of the future size and age structure of the population of local authorities in England. The latest 2012-based projections released by the ONS on 29 May show Bradford is projected to be home to 598,000 people by 2037. This is a 14.0% increase or 73,400 people in the 25 year period, lower than the equivalent national increase of 16.2%.

How a population is projected to change locally depends on a number of factors that can interact and produce very different growth rates to England as a whole. The size and age structure of the population at mid-2012 is a big indicator of the future population.

2012-based-pop-proj-wy

Bradford’s population as a whole is projected to be more heavily influenced by natural change (births – deaths) into the future. In later years of the projection, negative net migration plays a larger role in moderating growth.

Local planning needs such as change in service provision often relate to particular age groups and therefore it is important to understand projected changes to the age structure when planning for the future.

ONS has produced an on-line interactive tool for local comparisons of age/sex population projections-interactive-tool-projons for each single year.

Click here to download the data or for more information.


Geographies of diversity and ethnic mixing

geographies-of-diversity-coverThis release explores population change between censuses for ethnic minority groups in Bradford; describing the geographic distribution at ward level for each largest minority group. Segregation is considered using a dissimilarity index for ethnic minority group separation, including changes between censuses.

Summary findings

  • The non-white population in Bradford has grown by 68,500 persons over the past decade, which is an increase of two-thirds.
  • The ethnic minority population now represents one-third of the total population of Bradford.
  • The White British group remains the largest population accounting for more than 3 out of every 5 residents.
  • By far the largest ethnic minority group are Pakistani, accounting for around one-fifth of the population in Bradford.
  • The Bangladeshi population has almost doubled over the past decade, now with around 10,000 residents.
  • Black ethnic groups had the largest rate increase since 2001, however the Chinese population decreased by almost one-third.
  • Ethnic minority groups tend to be clustered around inner city Wards, and Keighley Central.
  • Residential mixing over the past decade had a general movement toward less separation for many ethnic minority groups.
  • The degree of this separation varies between groups, with Bangladeshi and Pakistani the most segregated and White Irish the least.

To open this statistical bulletin please click here.

How place influences employment outcomes for ethnic minorities

JRF-logoThis research looks at the influence of location on employment for ethnic minorities, asking why ethnic minority people fare disproportionately worse in the labour market in areas of high deprivation.

It examines the roles of culture, racism and class, and of familial, community and state support in affecting employment outcomes. It found that: Racism in education and employment varies by locality, contributing to differences in outcome by location.

Key points

  • Racism in education and employment varies by locality, contributing to differences in outcome by place.
  • Knowledge of education and labour market systems, and how to negotiate them, affects employment outcomes. Social segregation and migration tend to reduce knowledge and negotiating ability, leading to differing employment outcomes by place.
  • Whilst social segregation may provide support, it can also reduce employment performance, limiting social networks and inhibiting labour market knowledge. For some ethnic groups, segregation reinforces cultural norms of women’s role as nurturer rather than breadwinner. Self-employment appeared to exacerbate social segregation, especially where labour was limited to family.
  • There was some evidence that the relative size of ethnic minority groups in a locality might affect employment outcomes, with local policies likely to serve the largest ethnic minority group. This would contribute to differences in employment outcomes by place and should be explored further.
  • The extent to which education policies support all groups to benefit equally from education and careers support varies with place and differences in outcomes by ethnicity and migrant history result.
  • Providers of educational, careers and employment services need to reduce variations in access to services. Appropriate approaches may or may not be targeted at or tailored towards specific groups by ethnicity. However, it will be important to monitor by ethnicity how well key groups are served, particularly if the approach is not targeted.

To open the full report please click here.

Caring and earning among low-income Caribbean, Pakistani and Somali people

JRF-logoThis research looks at the experiences and preferences of low-income Caribbean, Pakistani and Somali people in balancing work and care responsibilities. It examines the particular challenges faced by these ethnic minority groups, and the challenges for employers and policy.

For most people, the two most important roles in life are caring for loved ones and working to earn a living. Over the past decades, more people have entered the labour market, while the proportion of those providing care has risen too. These developments create challenges for those seeking to ‘balance’ work and care, and are likely to continue given underlying demographic changes and developments in the labour market.

Key findings

  • Discrimination prevents low-income ethnic minority people from balancing work and care;
  • Many people are unaware of free childcare provision for 2-4 year olds;
  • Benefit changes are likely to make it more difficult to balance work and care for these people;
  • Attitudes towards caring vary greatly across ethnic groups; and
  • Caring responsibilities were predominantly taken up by women.

The report in full can be opened by clicking here.

The Environment and Health Atlas for England and Wales

obs-blog-health-atlasThe atlas provides interactive maps of geographical variations for a range of health conditions and environmental agents at a neighbourhood (small-area) scale in England and Wales.

The Environment and Health Atlas for England and Wales is an independent publication produced by the Small Area Health Statistics Unit, an academic unit funded by the Medical Research Council and Public Health England.

Aims

  • To provide baseline information for policy makers and the public on geographic patterns of environmental agents and disease.
  • To help in development of hypotheses to understand and explain variability in disease risk that may relate to the environment, lifestyle factors and/or location.
  • Following on from this, to help in development of research to investigate potential causal relationships between environment and health factors – where either evidence or lack of evidence for an effect provides important information to inform public health and policy.

Disability Free Life Expectancy at Birth and at ages 50 and 65 by Clinical Commissioning Groups, England, 2010-12

2011Census-logoDisability-free life expectancy (DFLE) estimates provide an insight into the population’s functional health by indicating the number of years an individual might expect to spend free from a limiting disability or health problem in his or her lifetime.

Using 2011 Census data, this analysis is the first to calculate DFLE by the newly established NHS Clinical Commissioning Groups. DFLE estimates are useful for those who plan and provide health and social care, nationally as well as locally.

Key points

  • Females spend more of their life with a disability compared with males, showing gender inequality in disability-free life expectancy (DFLE) across England.
  • Generally people living in Clinical Commissioning Groups (CCGs) in the North of England live more years with a disability compared to those in CCGs in the South.
  • Differences in DFLE are not solely confined to the North-South divide; males and females living in NHS Tower Hamlets.
  • The CCG with the largest difference between males and females in the proportion of life spent disability free is NHS Bradford City; 6.4 percentage points at birth and 9.6 at age 50.
  • At age 65 London based CCGs NHS Brent and NHS Harrow have the largest difference between males and females in the proportion of life spent disability free (8.7 percentage points).

The report in full can be opened by clicking here.

An interactive map is also available.